What does course correction look like?
Using data to maximise impact
Data is at our core
Data is at the core of all our programmes. Without quality evidence, we will not fully understand what does and does not work to maximise the potential impact for children. Only by investing in data and evidence can we measure the impact of what we do.
This data can provide important signals about areas that could be changed or adapted to increase impact. We call this course correction. Here are two examples of what course correction looks like from programmes in Malawi and Uganda.
Tracking new mums in Malawi
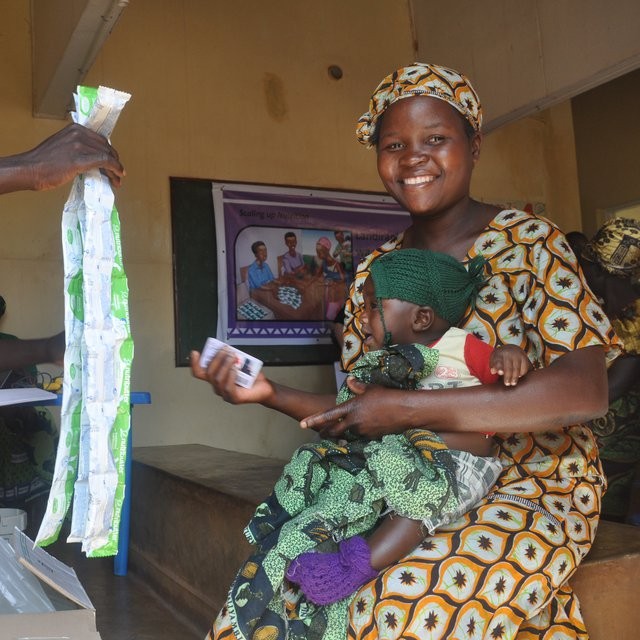
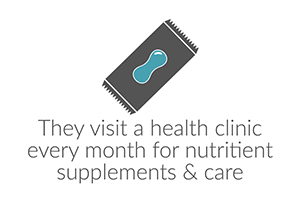
In Malawi, we are working with the World Food Programme and other partners to support the Government to tackle malnutrition. One in two children are stunted in Malawi, they are too short for their age. The programme aims to reduce stunting for children under the age of two in Ntichisi District. It provides mothers and children a package of high-impact interventions including nutritious foods (lipid-based nutrient supplements), and care to improve dietary diversity and health. An innovative real-time management and monitoring tool tracks those mothers and children who receive assistance.
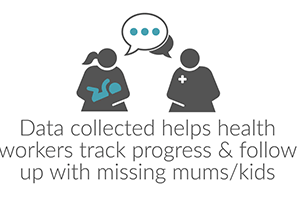
This simple system means community health workers and care groups can monitor new mothers and provide extra support for those who need it.
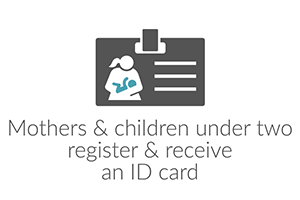
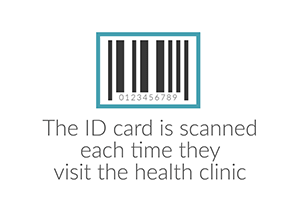
How the programme works
Attendance grew from 65.6% to 82.9%
Targeting under-twos
Popularity of the programme led to increased demand for the nutritious food for children of all ages. Examining the data on the age of children receiving treatment showed that children over the age of two accounted for 21% of the total number served by the programme, despite its specific focus on children under two.
With this data to-hand, partners course corrected so that only children under the age of two were part of the programme. With the implementation of new measures to track children’s age, the percentage of children over two participating dropped to almost zero. This saved the equivalent of one whole container of supplements, worth $50,000.
.
LIVING GOODS
Focusing on impact
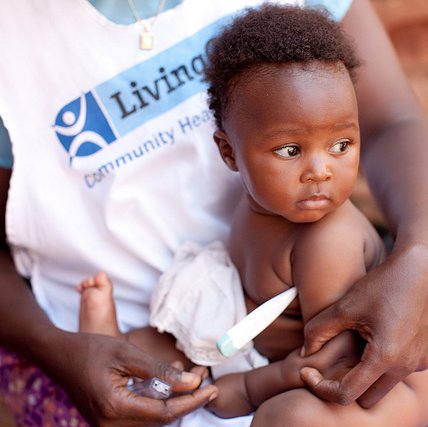
In Uganda, we worked with Living Goods and BRAC to create a network of community health promoters to deliver lifesaving information and products to families in rural and urban communities. This network has helped expand the market for a range of health and consumer products from medicines for diarrhoea, malaria and pneumonia to bed nets and contraceptives.You can read more about the programme living.
The importance of generating high-quality data to track progress on an ongoing basis and inform course corrections was recognised from the outset of the programme. Outcome tracking surveys were undertaken at regular intervals to understand how effective the community health promoters were, which services they were providing and who the main beneficiaries were.
Finding truth in data
The first tracking survey undertaken at the end of the first year (2010) revealed two important findings.
Firstly, it showed the programme was not serving the intended target group of children under the age of five as well as expected. The survey showed that a number of health promoters had no contact with families with children in a given month.
Secondly, the survey and impact model helped identify that the programme’s goals of affecting more than ten health outcomes meant that the focus on the main causes of childhood mortality (such as malaria and diarrhoea) was not as strong as it could be.
A cluster-randomised trial was conducted in 2013, after approximately three years of implementation. The evaluation compared ‘treatment’ villages where community health promoters delivered their services with control villages that did not receive the intervention.
It showed a 26% reduction in under-five mortality in the ‘treatment’ villages.
26% reduction in under-5 mortality
WHAT DOES COURSE CORRECTION LOOK LIKE?
For more on our work in Malawi with the World Food
Programme, visit our grant page.
To learn more about our work with Living goods, read